Are you Betting over or under in today’s game? Learn how to predict scoring in MLB to pick a winner.
Usually on the first page of google, after googling MLB over-under, you’ll find a bunch of sites trying to sell picks or guessing team totals. What a load of trash!!
Welcome to the most thorough guide to MLB Scoring online.
It’s not a simple subject, but nevertheless important for those free thinkers who like betting baseball totals.
Grab a coffee and enjoy.
Baseball is a game that combines individual effort, strategy, teamwork and superior hand eye coordination.
At the highest level in the Major Leagues, all of those factors as well as weather conditions and ballpark effects can alter the outcome of the game.
The beauty of the game is that one game can be determined by a slim 1-0 score,
while another with the identical teams playing can produce a scoring outburst of 23-22.
So what determines why and how scoring with same teams can be dramatically different from one game to the next?
Before that is addressed, let’s take a look back in time. During the early stages of baseball,
offensive and defensive strategies were at a premium.
Pitchers didn’t throw as hard, the gloves were inferior and the ball didn’t travel as far.
As a result, offensive teams had to use utmost strategy to move base runners via the stolen base,
bunting and hitting the ball the other way to move runners.
In general, without the threat of the long ball, teams needed more hits to score runs.
When Babe Ruth shattered home run records, more players and teams than ever before hit for the fences.
Still, the game was more strategically oriented on the offensive side of the ball than in today’s game.
Managers generally kept starting pitchers in there for as long as they could go and relievers were used at a minimum.
It was not uncommon for pitchers to start 40 games in a season hurl over 300 innings and complete 20 more games in a season.
That has also changed dramatically, particularly in the current era of baseball,
where a complete game is a rare event and pitch counts are used religiously.
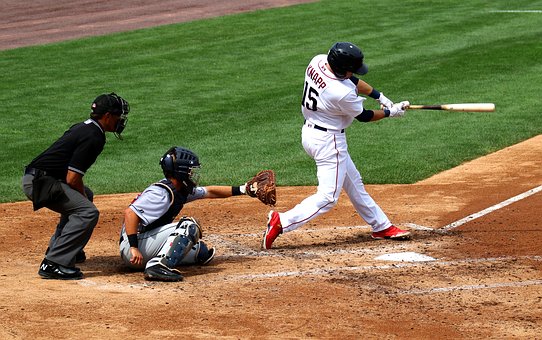
Hitting and Power
Fast forward to the current era in hitting and power is the name of the game.
While home runs gradually increased over time, the past three seasons of Major League Baseball
have provided the 4th, 1st, and 3rd highest home run seasons in the history of the game.
Launch angles are emphasized when years past the message was not to uppercut the swing.
The theory was to swing down through the ball to hit hard line drives, while home runs would come for those with the most power.
Now, lead-off men are swinging for the fences and strikeouts are at an alarming rate.
Batting average, once thought of to be a good measure for a hitter, is not nearly as important in today’s game.
On-base percentage, slugging percentage, and OPS (on-base percentage plus slugging percentage)
are major offensive statistics by which hitters are being measured.
Examining hitting closely, their hits to runs ratio in MLB last season was 1.9 to 1.
The runs to home runs ratio were 3.88 to 1, so nearly one run out of every four is accounted for by the home run.
Clearly the home run produces runs faster, after all it’s at least one run per home run.
Hitting only singles, it will take at least two or perhaps three singles to produce a run.
The at-bat per home run ratio in MLB last season was 29.6 to one.
There will be a minimum of 51 outs for a nine-inning game,
and with an average of 8.5 hits per team per game last season, that’s an additional 17 at-bats.
Therefore with a minimum at 68 at-bats per game, there was an average of about 2.3 home runs per game last season.
When top home run hitting teams take the field, the hits to runs ratio will decline while the at-bats per home run ratio will decline as well.
This would create an even higher scoring contest.
While strikeouts are up in the league, that also means grounding into double plays should theoretically go down.
That means more at-bats and more runs being score.
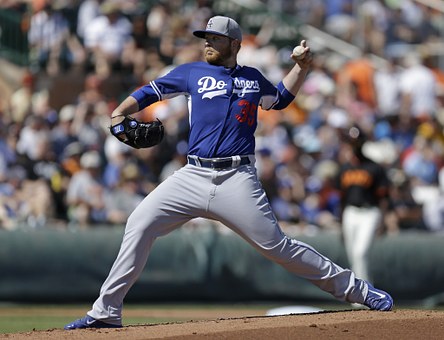
Pitching Factors
Examining the pitching factors that influence the number of runs scored per game.
The MLB earned run average last season was 4.14 which is not all that much different from years past, despite the increased home run totals.
This could be in large part due to the almost one strikeout per inning pitched last season, a very high total.
Not a surprise considering that starters are going only six or seven innings, compared to complete games years ago.
Specialty relievers hitting 100 miles per hour is the norm instead of the exception.
Incredibly walk totals are only 3.2 per nine innings, a low number for the power pitching displayed.
Base runners are down but home run totals remain high. Baseball has now become a main power-oriented game.
Because of the nature of baseball today in terms of power, there is less strategy seen on offense.
Stolen bases are an exception, bunting is rare, hitting to move the runners is hardly seen.
However, managerial strategy in terms of using the bullpen, defensive alignment shifts, and outfield alignment shifts are all on the rise.
In fact, four outfielders with three infielders on one side of the diamond was seen in preseason games this year,
something is never before seen in Major League Baseball.
Ball Park Effects and betting baseball totals.

Looking at the ballpark effects, clearly, location plays a role in the total number of runs scored in a game.
Citi Field (home of the New York Mets), Marlins Park (home of the Florida Marlins),
Oakland Coliseum (home of the A’s), TMobile Park (home of the Mariners)…
and Dodger Stadium (home of the Los Angeles Dodgers) were the five toughest parks to score in.
This could be due to multiple factors, including weather conditions,
amount of foul territory (Oakland Coliseum has largest foul territory in MLB), distance to the fences, etc.
On the flip side, Globe Life Park (home of the Rangers), Coors Field (home of the Rockies),
Nationals Park (home of the Nationals)
Great American Ball Park (home of the Reds) and Progressive Field (home of the Indians)
are the five easiest parks to score.
Interestingly enough, Chicago’s Wrigley Field is known for having balls fly out of the park and yet Wrigley Field is not in the top five easiest parks to hit a home run. This is due to weather conditions.
When the wind is blowing out, the balls fly out of the park. However,
when the wind is blowing in, it’s nearly impossible to hit a home run there.
Therefore, the weather conditions balance each other.
Another interesting statistic is Citizen’s Bank Park in Philadelphia….
It is the fourth easiest park to hit a home run in,
yet only 12th best hitters park in terms of overall run production.
The toughest stadiums to hit a home run in are Marlins Park, Oracle Park (home of the Giants),
Oakland Coliseum, SunTrust Park (home of the Braves) and PNC Park (home of the Pirates).
Teams entering those stadiums need to go back to the more fundamental offensive approach to have significant success there.
The Weather Factor – MLB over unders Today

Another major factor in run production is weather conditions.
Major League Baseball begins in April and ends in as late as late October before the World Series is completed.
Cities such as Philadelphia, Boston, New York, Cleveland and others can play nearly a whole month in cool weather.
The ball does not carry off the bat as far in cooler air.
The best hitting occurs mainly during the hot, humid summer months when the ball carries significantly farther.
Speaking of carrying farther, a huge reason Coors Field is among the most hitter friendly parks is due to the thin air in Denver,
causing an increase in distance by as much as 10 or 15 percent.
All of these factors influence the amount of scoring in a baseball game.
Day Games Versus Night Games,hitting background and Umpiring.
Other factors that influence the number of runs scored in a baseball game are day games versus night games,
hitting the background, and umpiring crew.
There are significantly more night games in Major League Baseball than day games.
Early in the season day games might be on the schedule in the cooler climate locations.
After that, only the occasional weekday, Saturday and most Sundays are day games scheduled.
Having said that, players have noted that it’s much easier to see the ball during the day to hit.
Picking up the rotation of the ball is paramount to determine the type of pitch and no matter how efficient stadium lighting is in today’s game
… it’s not as good as natural sunlight.
Another factor during day games, particularly in the summer is the heat.
That wears down pitchers quicker, forcing teams to go to the bullpen early. This generally favors the offense.

Also, the clear blue sky can make a ball difficult to play out of the sun, increasing the likelihood of a hit.
Another time of day that is difficult for defensive players is sunset, again making tracking a fly ball sometimes an adventure.
During the late afternoon in many stadiums around the league,
shadows will creep past home plate extending towards the pitching mound.
When this occurs, advantage pitchers and less likely runs will score.
Picking the ball up after it goes from sun to shadow is very difficult against today’s flame throwers.
Something that may not seem to be a factor in hitting is the background, particularly in center field.
When a batter is at the plate concentrating on the release point of a pitch, in the background is the center field area.
If the background is a solid dark color, such as a fence of grass with no stands,
it’s much easier to concentrate on picking up the ball.
On the other hand, seeing a sea of fans wearing multiple colors is distracting or even worse,
all white shirts which can blend into the ball.
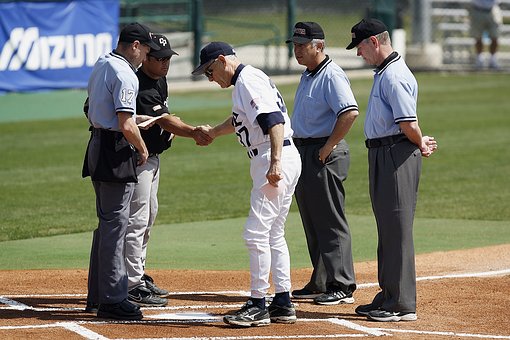
Also,the men in blue, the umpires can clearly have an influence on offensive production.
Some umpires are noted for having a large strike zone, expanding strike calls to pitches several inches off the plate.
This gives an advantage to the pitchers and generally results in lower-scoring games.
On the other hand, the umpires shrink the strike zone making it easier on the hitters,
to look for pitchers nearly right down the middle of the plate.
When those umpires are working the game, expect the scores to be significantly higher.
Proposed Rule Changes
Proposed Major League rule changes could alter the number of runs scored.
One proposition is that all pitchers must face at least three batters,
which eliminates the often used pitcher appearing to get out a single batter.
If the proposed rule change goes into effect, those “specialty” pitchers, suppose a lefty to get out another lefty,
will be forced to face hitters who could do some damage.
Another proposed rule change which will be used in the independent Atlantic League,
is moving the pitching mound back two feet.
It might not sound like much, but it will alter when and how much a pitcher’s ball will move as it crosses the hitting zone.
It will also give batters more time to catch up to the increasing speed on pitches seen in today’s game.
Finally, the designated hitter is being strongly considered for the National League.
The rule was created for the start of the 1973 season.
With pitchers batting in 1972, there were 6441 runs scored, for an average of 3.47 per game.
The scoring output jumped to 8314 runs and 4.28 per game.
With the increased offense in today’s game,
the percent increase in runs scored would likely be higher if the National League adopts the rule.
Next time you’re considering watching or betting totals in a baseball game, specifically at the highest level of MLB,
take into account all the factors mentioned above.
Overall team hitting, starting pitching, relief pitching, defensive and pitching strategies,
stadium and weather conditions all play a role in the amount of runs scored per game.
Understanding these factors will help when betting baseball over and unders,
and also enhance the enjoyment of one of the greatest sports in the world.
Its also very important that we talk about some key numbers when betting MLB Totals.
These are the numbers that you’ll see at the online sportsbooks and represent the final score in the game you’re betting over/under.
Because an MLB game cant end in a tie, the odd numbers are the most common. With 7, 9, and 5 topping the list.
What do you think? Please leave a comment below. Let’s gear up for next season’s MLB over under-picks.
